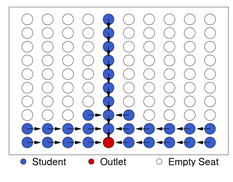
Ping Pong Unit Hydrograph App
Unit hydrographs are an important concept in hydrology. This app simulates the 'Ping Pong Ball Unit Hydrograph' exercise outlined in Shulz et al. (2018) and can be a useful teaching tool. 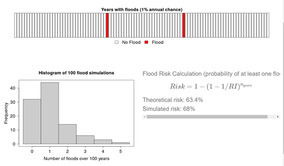
Flood Frequency App
This app helps visualize the probabilities associated with flood events of different recurrence intervals. There are common misperceptions on the likelihood of different size floods occurring (e.g., the "100-year flood" has a 1% chance of happening in any year). This app can help students understand these important concepts. 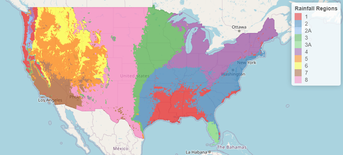
U.S. Precipitation Region App
This app summarizes data from our recent publication, which used PRISM rainfall data to divide the conterminous U.S. into regions based on similarities in precipitation metrics. This can be useful for stormwater design and regulations. The app allows to view the rainfall regions and the precipitation metrics themselves. 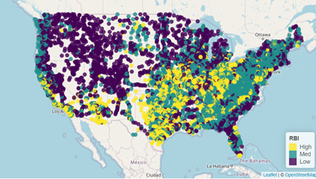
USGS Gage Finder/Stream Flashiness App
This app serves two purposes. First, it can be used to find USGS stream gages that meet certain criteria (e.g., location, drainage area, years with data). Second, the app displays the "flashiness" of different streams with gage data (computed using the Richards-Baker Flashiness Index - or RBI). Flashy streams are those where flows change quickly - for example, in urban areas with lots of impervious area. River Erosion Model (REM)
REM is a custom hydro-geomorphic model that can simulate stream channel erosion throughout a river network. Primary inputs include stream channel geometry, bed and bank properties (e.g., grain size and soil cohesion), and a time series of discharge. The model has been used to simulate trajectories of channel change, sediment and phosphorus loading associated with channel erosion, and the relative effects of stormwater management and stream restoration for reducing channel erosion. See the model User Guide for more details. 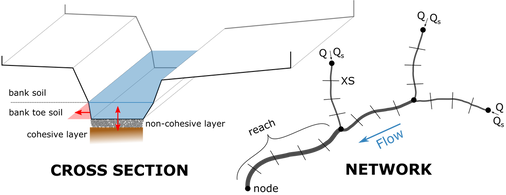
|